borough · Montreal
Living in L'Île-Bizard-Sainte-Geneviève
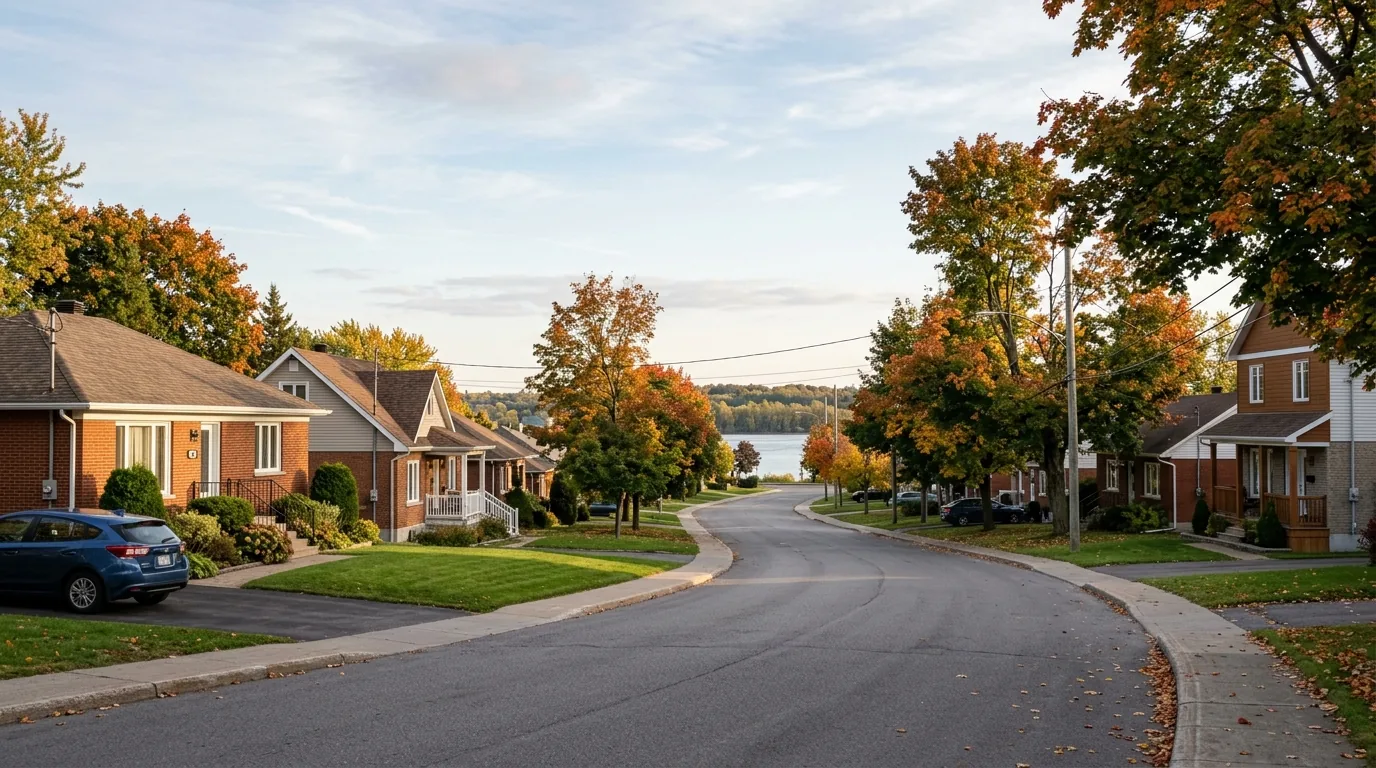
L'Île-Bizard-Sainte-Geneviève is one of the 19 boroughs covered on this site, with 7,464 dwellings on the assessment roll. Its crime rate, measured against the number of dwellings, sits at 18.0, which is below the city average, placing the borough at rank 4 among Montréal boroughs when they are ordered from the lowest rate upward. The pages below set those figures beside regional rent data so you can see the borough in context.
Safety and reported crime
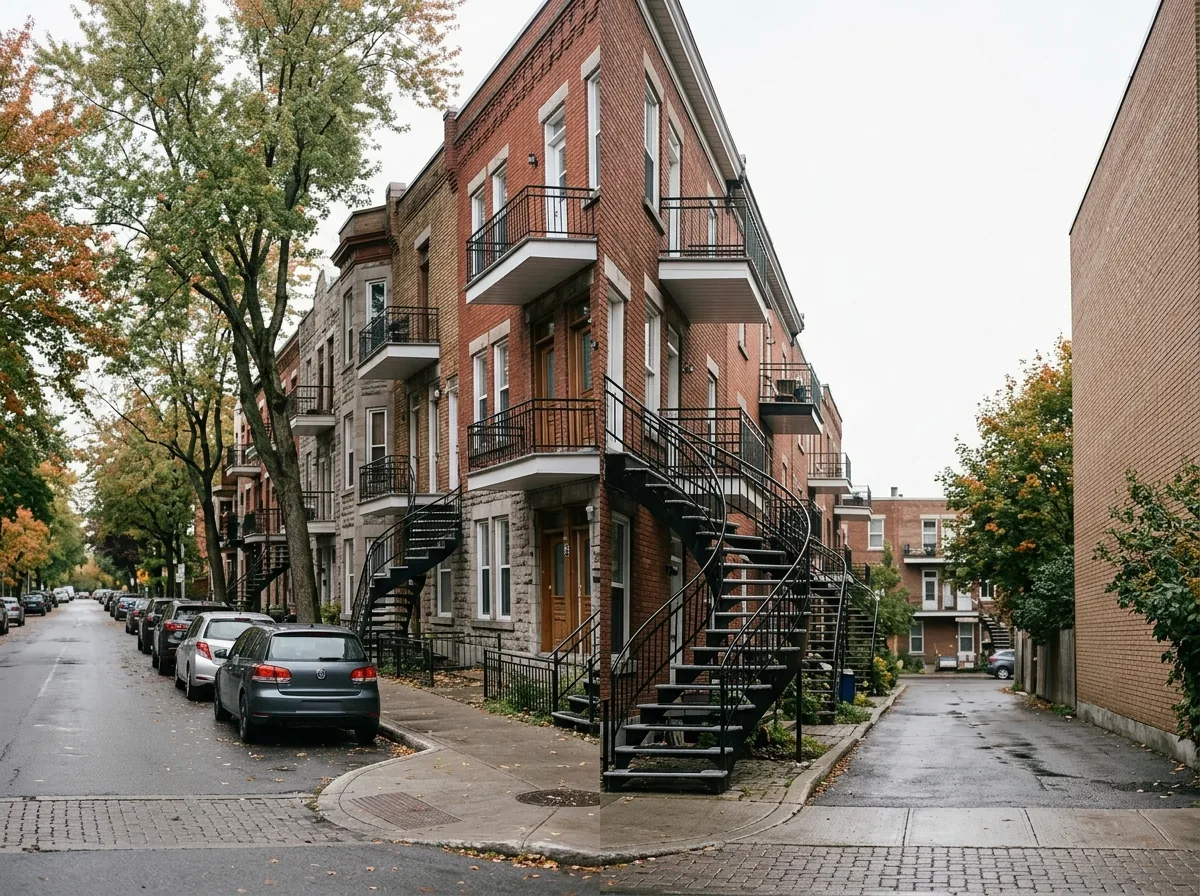
Over the most recent full year of data, police reported 134 located criminal acts in L'Île-Bizard-Sainte-Geneviève, compared with 88 in the preceding equivalent period. That amounts to a change of 52.3%, and the trend is described as rising. Relative to the number of dwellings, the rate stands at 18.0, against 23.6 for all boroughs combined, so the borough remains below the city average.
The single most frequent category is thefts from vehicles, which accounts for 43.3% of the located acts. Break-ins totalled 37 over the same period, a rate of 5.0 relative to the number of dwellings, compared with 5.8 across the city; that places break-ins below the city average, with a trend described as rising.
One caveat applies everywhere in Montréal: 15.2% of published criminal acts carry no location and therefore cannot be attributed to any borough. Small territories also show larger swings from one year to the next, so a single year should be read as a snapshot rather than a verdict.
Break-ins per 1,000 dwellings, all boroughs : 5.8
Housing stock and building age
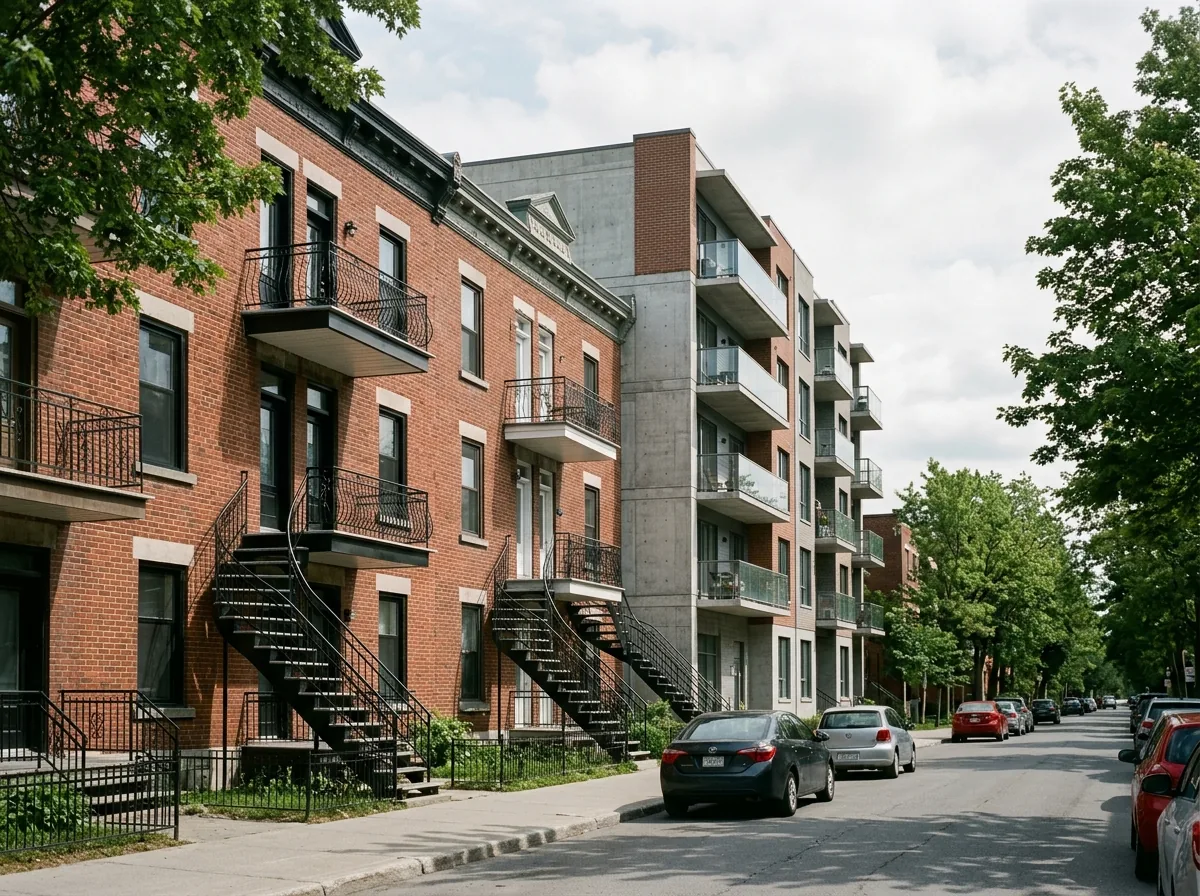
The assessment roll lists 7,464 dwellings in L'Île-Bizard-Sainte-Geneviève. Condominium units make up 5.3% of that stock, so most households here live in other forms of tenure and building type.
The median construction year is 1986, and 12.5% of dwellings date from the older pre-war and early post-war stock. In practice, buyers should expect a mix of eras: a majority of relatively recent construction alongside a visible minority of older buildings, where inspection of roofing, plumbing, electrical systems and foundations deserves particular attention.
Rents: regional context
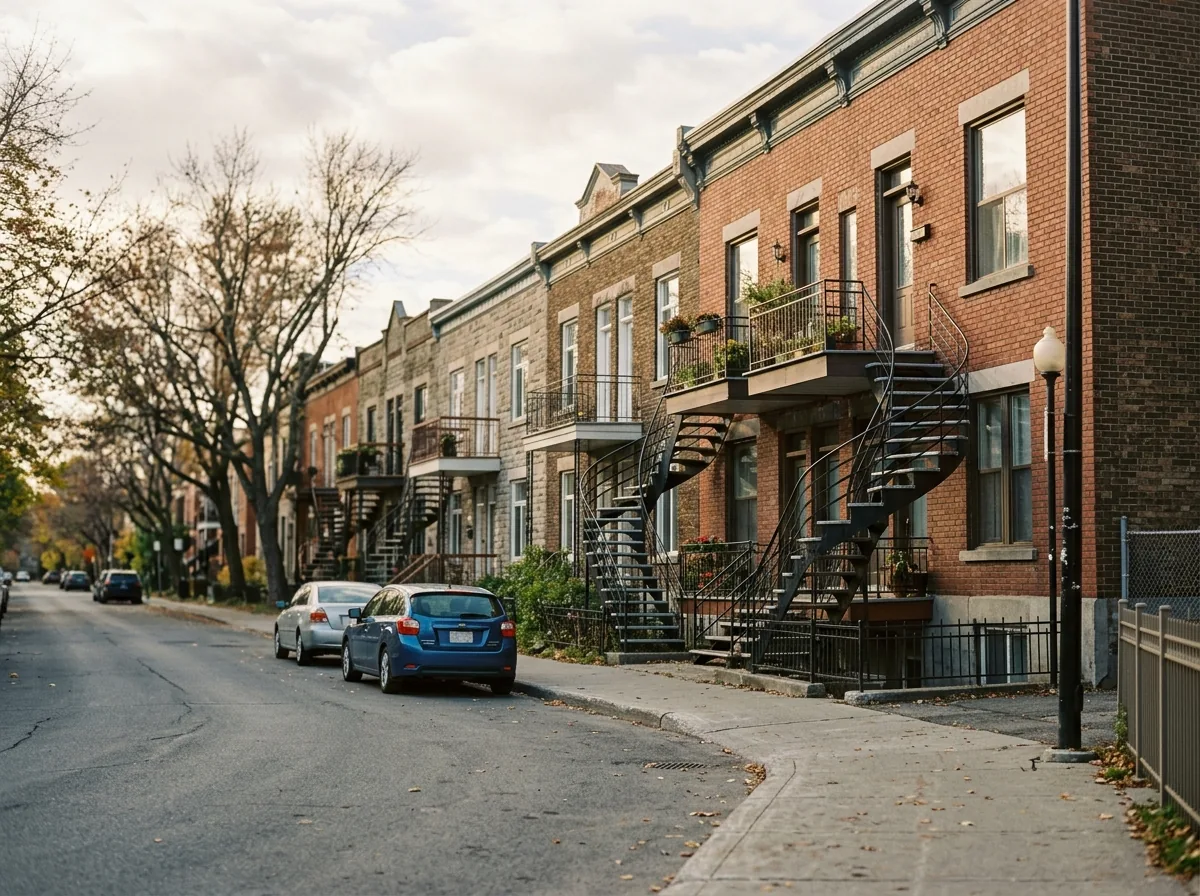
No rent survey is published at the borough level. The figures below come from the annual survey for the Montréal census metropolitan area in 2025 and describe the region as a whole, not L'Île-Bizard-Sainte-Geneviève specifically.
Across the metropolitan area, the average rent for a bachelor unit is $1,005. Units listed under the smaller apartment category average $1,131, mid-sized units average $1,346, and the largest category averages $1,625. The exact definition of each category appears in the facts table.
Actual asking rents in any given borough can sit well above or below these regional averages, especially for units that have recently turned over, so treat them as a benchmark rather than a price list.
Practical notes for newcomers
Because break-ins here are below the city average but trending rising, basic prevention still pays off: solid locks on doors and patio sliders, exterior lighting, and not leaving valuables visible. Since thefts from vehicles is the leading category, parking habits matter as much as door security — empty the vehicle, lock it, and avoid leaving documents or electronics inside.
Home and tenant insurance quotes take claims history and building age into account, and 12.5% of the local stock belongs to the older era, where original systems may affect coverage or premiums. Ask your insurer what documentation it wants before you sign anything.
If you are buying, a mortgage pre-approval obtained before you start visiting sets your realistic budget and protects you from rate movement during your search. With condominium units at just 5.3% of the stock, expect a narrow selection in that segment and be ready to consider other property types. This page is general information, not professional financial, legal or insurance advice.
Frequently asked questions
Is L'Île-Bizard-Sainte-Geneviève a safe borough?
Measured against the number of dwellings, the crime rate is 18.0, compared with 23.6 for all boroughs combined, which is below the city average. The borough ranks 4 when boroughs are ordered from the lowest rate upward. Police located 134 criminal acts there over the most recent full year of data, with a trend described as rising.
How common are break-ins in L'Île-Bizard-Sainte-Geneviève?
There were 37 break-ins over the most recent full year of data, a rate of 5.0 relative to the number of dwellings, against 5.8 city-wide. That is below the city average, and the year-over-year trend is rising.
What kind of housing will I find in L'Île-Bizard-Sainte-Geneviève?
The assessment roll counts 7,464 dwellings. The median construction year is 1986, 12.5% of units belong to the older stock, and condominiums represent 5.3% of all dwellings, so options in that segment are limited.
All the data
| Indicator | Value | Source |
|---|---|---|
| Break-ins (last 12 months) Period : 2025-09-01 → 2026-08-31 | 37 | Criminal acts |
| Break-ins compared with the city Period : 2025-09-01 → 2026-08-31 | below the city average | Criminal acts |
| Break-ins per 1,000 dwellings Period : 2025-09-01 → 2026-08-31 | 5.0 | Criminal acts |
| Year-over-year break-in trend Period : 2025-09-01 → 2026-08-31 | rising | Criminal acts |
| Share of dwellings in condominiums | 5.3% | Property assessment units |
| Year-over-year change in criminal acts Period : 2025-09-01 → 2026-08-31 | 52.3% | Criminal acts |
| Crime rate compared with the city Period : 2025-09-01 → 2026-08-31 | below the city average | Criminal acts |
| Rank by crime rate (1 = lowest) Period : 2025-09-01 → 2026-08-31 | 4 | Criminal acts |
| Criminal acts per 1,000 dwellings Period : 2025-09-01 → 2026-08-31 | 18.0 | Criminal acts |
| Year-over-year crime trend Period : 2025-09-01 → 2026-08-31 | rising | Criminal acts |
| Located criminal acts (last 12 months) Period : 2025-09-01 → 2026-08-31 | 134 | Criminal acts |
| Located criminal acts (previous 12 months) Period : 2024-09-01 → 2025-08-31 | 88 | Criminal acts |
| Dwellings on the assessment roll | 7,464 | Property assessment units |
| Median construction year | 1986 | Property assessment units |
| Dwellings built before 1960 | 12.5% | Property assessment units |
| Most frequent category Period : 2025-09-01 → 2026-08-31 | thefts from vehicles | Criminal acts |
| Share of the most frequent category Period : 2025-09-01 → 2026-08-31 | 43.3% | Criminal acts |
Regional context
| Indicator | Value | Source |
|---|---|---|
| Boroughs covered | 19 | Administrative boundaries of the agglomeration |
| Break-ins per 1,000 dwellings, all boroughs Period : 2025-09-01 → 2026-08-31 | 5.8 | Criminal acts |
| Criminal acts per 1,000 dwellings, all boroughs Period : 2025-09-01 → 2026-08-31 | 23.6 | Criminal acts |
| Average rent, Montréal CMA: one bedroom Period : 2025 | $1,131 | Average rents (Rental Market Survey) |
| Average rent, Montréal CMA: two bedrooms Period : 2025 | $1,346 | Average rents (Rental Market Survey) |
| Average rent, Montréal CMA: three bedrooms or more Period : 2025 | $1,625 | Average rents (Rental Market Survey) |
| Average rent, Montréal CMA: bachelor Period : 2025 | $1,005 | Average rents (Rental Market Survey) |
| Rent survey year | 2025 | Average rents (Rental Market Survey) |
| Share of criminal acts published without a location Period : 2025-09-01 → 2026-08-31 | 15.2% | Criminal acts |
Comments
No comments yet.