borough · Montreal
Villeray-Saint-Michel-Parc-Extension
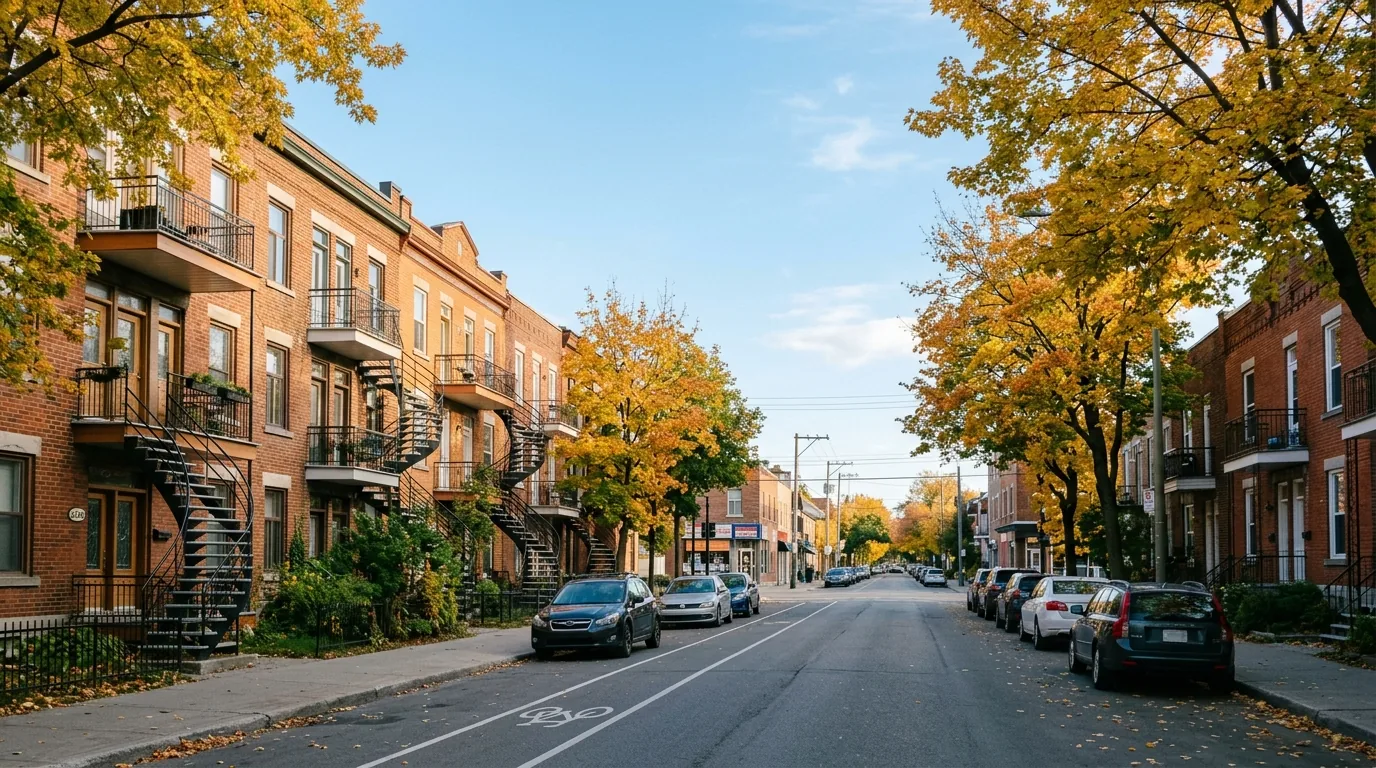
Villeray-Saint-Michel-Parc-Extension is one of Montréal's boroughs, with 73,414 dwellings on the assessment roll and a housing stock that leans clearly toward older buildings. Its crime rate, measured against the number of dwellings, sits at 23.3 and is close to the city average, while break-ins are close to the city average. The figures below combine borough-level open data with regional rent context for the Montréal area.
Safety and reported crime
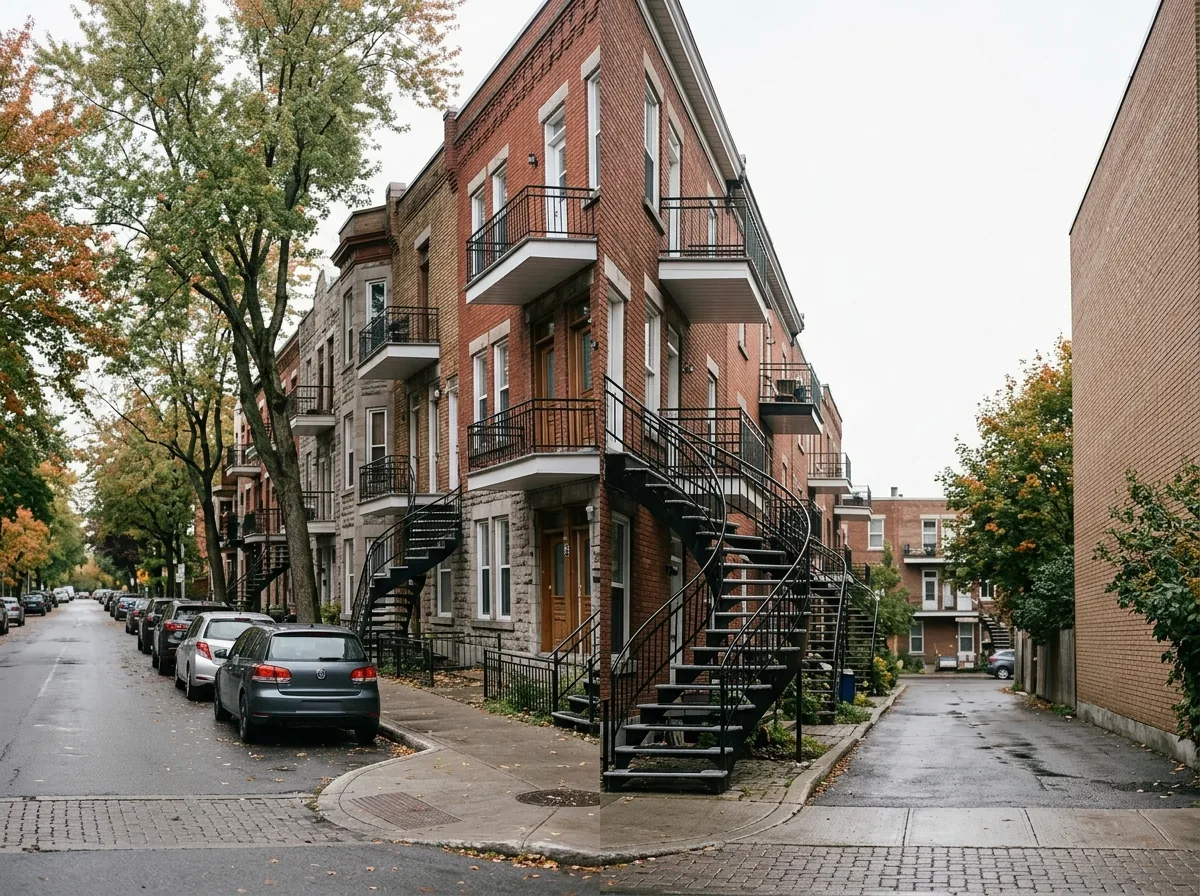
Over the most recent full year of data, 1,707 located criminal acts were recorded in the borough, compared with 1,676 in the preceding equivalent period, a change of 1.8%. The overall trend is described as stable.
Relative to the number of dwellings, the borough records 23.3 criminal acts, against 23.6 for all boroughs combined, which places it close to the city average. By rank, where the lowest rate comes first, Villeray-Saint-Michel-Parc-Extension sits at position 14 among the boroughs covered by this site. The most frequent category is thefts from vehicles, accounting for 28.1% of located acts.
Break-ins specifically totalled 421 over the same window, or 5.7 relative to the number of dwellings, compared with 5.8 across the city; that places the borough close to the city average, with a trend described as stable. Keep in mind that 15.2% of criminal acts published city-wide come without a precise location, so borough totals understate the true volume.
Break-ins per 1,000 dwellings, all boroughs : 5.8
Housing stock
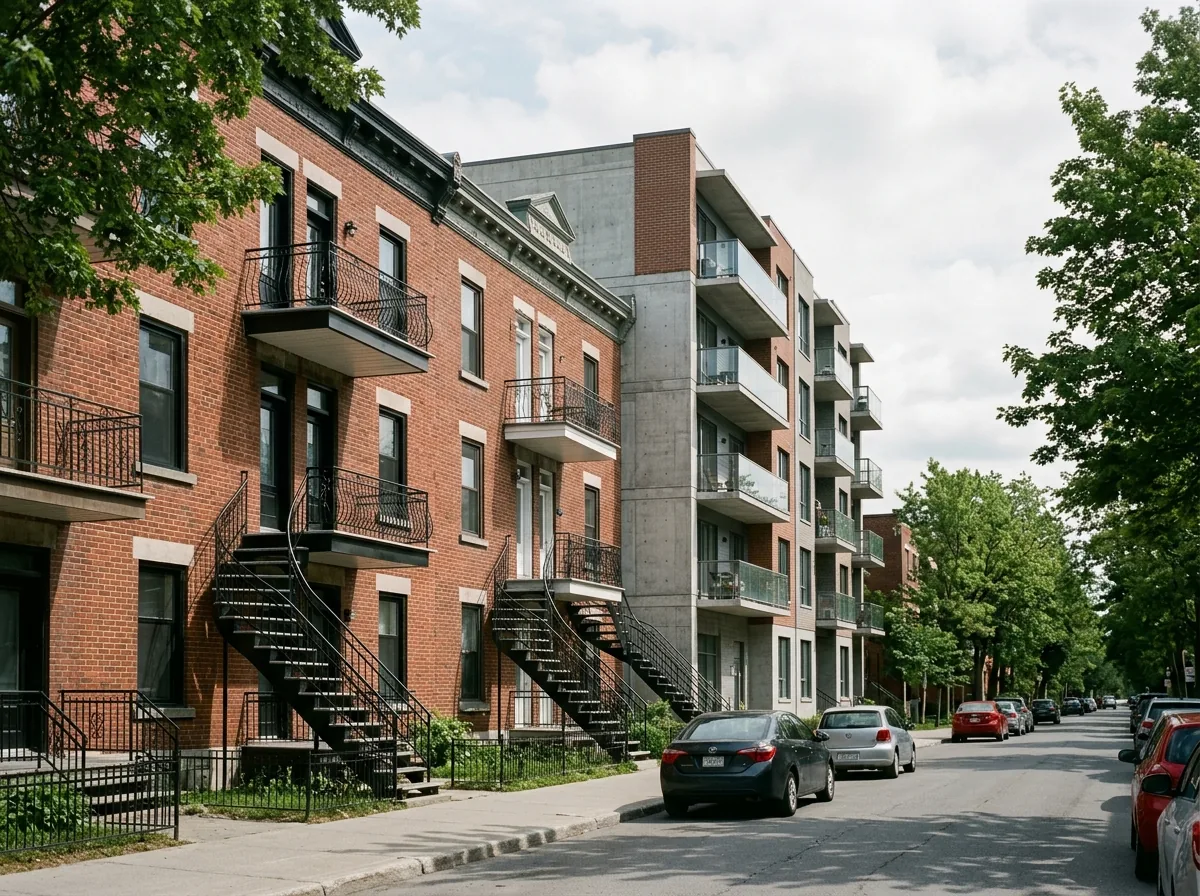
The assessment roll lists 73,414 dwellings in Villeray-Saint-Michel-Parc-Extension. Condominium units make up 7.3% of that stock, a modest share, which means most households live in rental buildings, plexes and other non-divided forms of ownership.
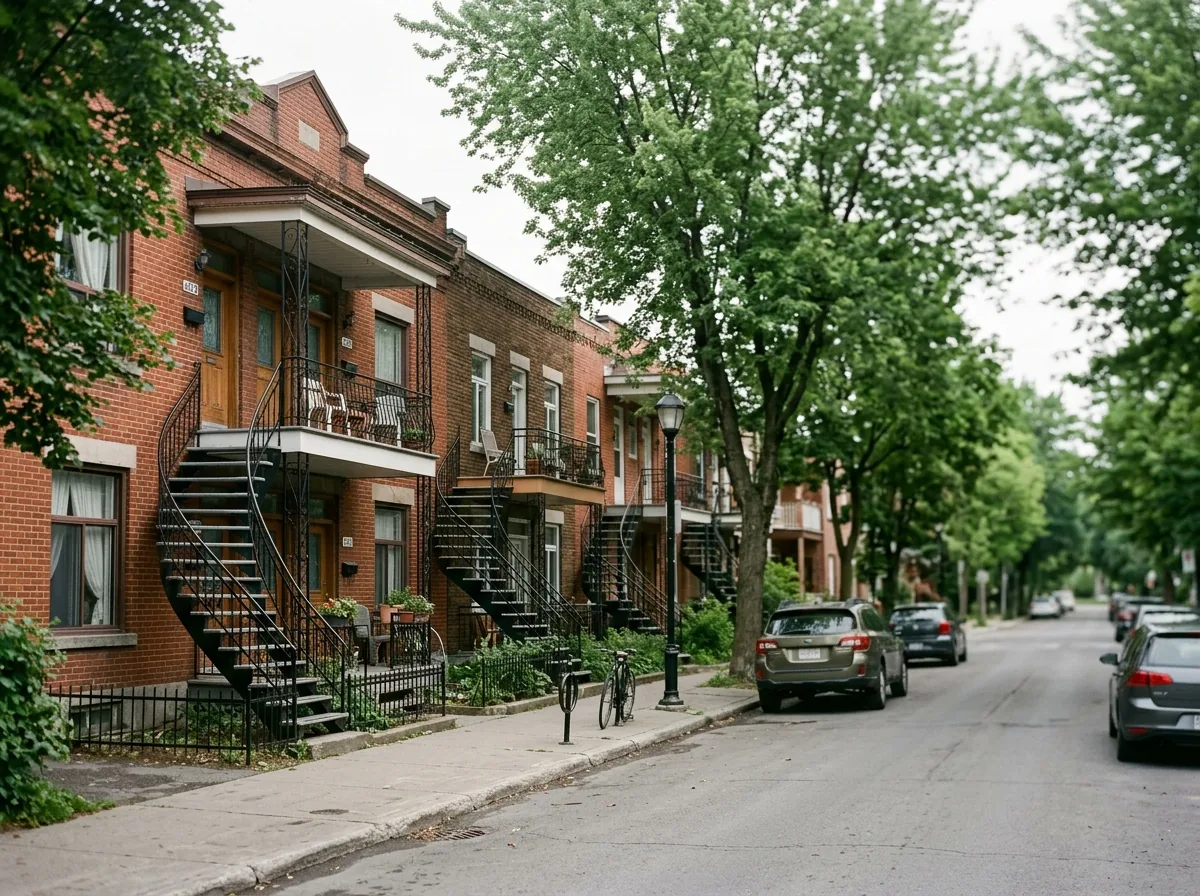
The building stock is old by Montréal standards: the median construction year is 1956, and 63.0% of dwellings were built before the date shown in the facts table. Buyers should budget for the usual questions that come with older construction, from roofing and plumbing to electrical panels and window condition, and should expect inspection reports to matter a great deal.
Rents: regional context
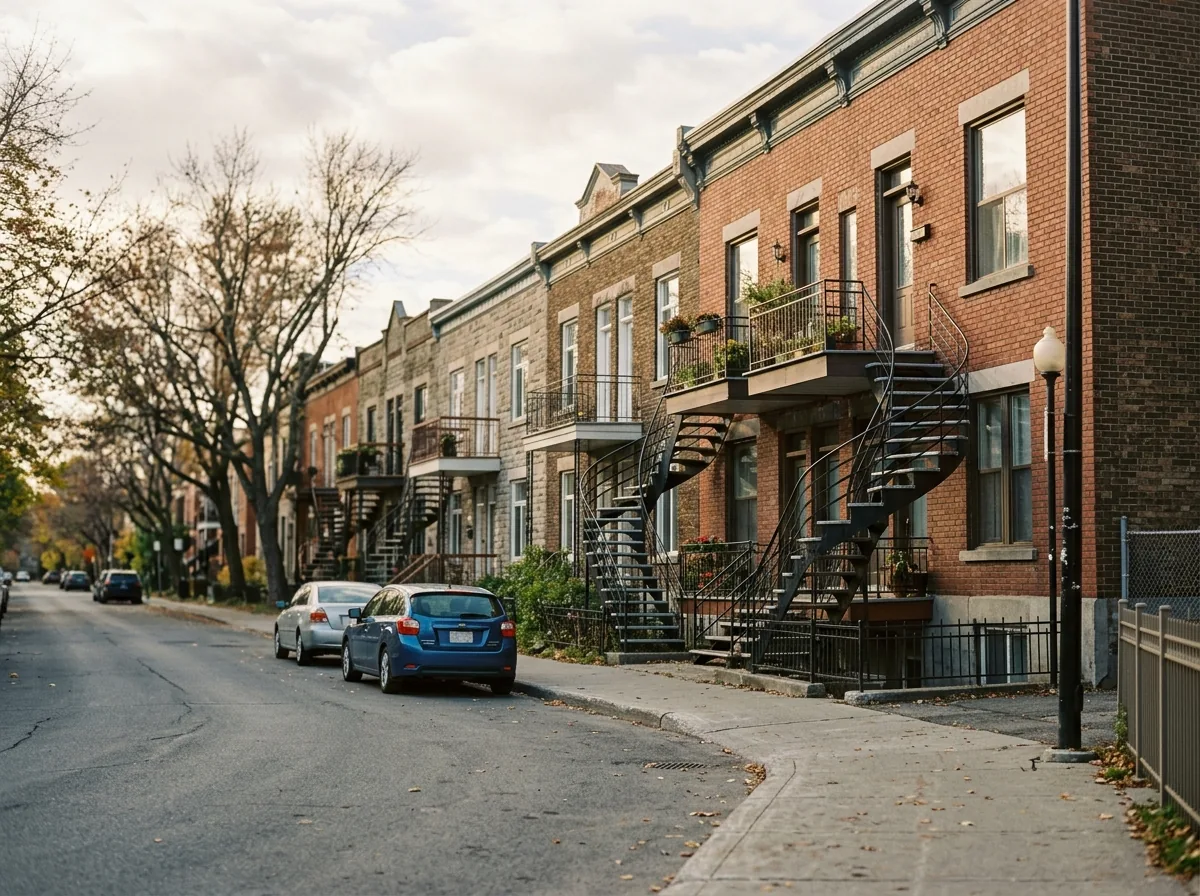
The rent figures on this page come from the Canada Mortgage and Housing Corporation survey for the Montréal census metropolitan area as a whole, for the survey year 2025. They are regional averages, not measurements for Villeray-Saint-Michel-Parc-Extension, and actual asking rents in the borough may sit above or below them.
Across the metropolitan area, the average rent is $1,005 for a bachelor unit, $1,131 for a smaller one-bedroom apartment, $1,346 for a mid-sized unit and $1,625 for the largest family-sized apartments. Because surveyed averages include long-occupied units, newly listed apartments frequently rent for more.
Practical notes for newcomers
With break-ins close to the city average and the overall crime picture close to the city average, standard precautions are enough for most households: solid door hardware, secured ground-floor and basement windows, and care with items left visible in parked vehicles, given that the leading category here is thefts from vehicles.
If you are buying, ask your lender about a pre-approval before you shop, and confirm what an insurer will require for a building of the age typical in this borough, since 63.0% of dwellings predate the cut-off shown in the facts table. Older electrical systems, plumbing and heating oil tanks are common triggers for insurer questions.
If you are renting, compare listings with the regional averages above rather than treating those averages as borough rents, and visit at different times of day to get a feel for the street before signing.
Frequently asked questions
Is Villeray-Saint-Michel-Parc-Extension a safe borough?
Its crime rate relative to the number of dwellings is 23.3, compared with 23.6 for all boroughs, which makes it close to the city average. It ranks at position 14 when boroughs are ordered from the lowest rate upward, and the trend is stable.
How common are break-ins in Villeray-Saint-Michel-Parc-Extension?
Over the most recent full year of data, 421 break-ins were recorded, or 5.7 relative to the number of dwellings, against 5.8 city-wide. That is close to the city average, with a stable year-over-year trend.
What kind of housing will I find in Villeray-Saint-Michel-Parc-Extension?
The roll lists 73,414 dwellings. Condominiums account for 7.3% of them, and 63.0% of dwellings were built before the date shown in the facts table, with a median construction year of 1956.
All the data
| Indicator | Value | Source |
|---|---|---|
| Break-ins (last 12 months) Period : 2025-09-01 → 2026-08-31 | 421 | Criminal acts |
| Break-ins compared with the city Period : 2025-09-01 → 2026-08-31 | close to the city average | Criminal acts |
| Break-ins per 1,000 dwellings Period : 2025-09-01 → 2026-08-31 | 5.7 | Criminal acts |
| Year-over-year break-in trend Period : 2025-09-01 → 2026-08-31 | stable | Criminal acts |
| Share of dwellings in condominiums | 7.3% | Property assessment units |
| Year-over-year change in criminal acts Period : 2025-09-01 → 2026-08-31 | 1.8% | Criminal acts |
| Crime rate compared with the city Period : 2025-09-01 → 2026-08-31 | close to the city average | Criminal acts |
| Rank by crime rate (1 = lowest) Period : 2025-09-01 → 2026-08-31 | 14 | Criminal acts |
| Criminal acts per 1,000 dwellings Period : 2025-09-01 → 2026-08-31 | 23.3 | Criminal acts |
| Year-over-year crime trend Period : 2025-09-01 → 2026-08-31 | stable | Criminal acts |
| Located criminal acts (last 12 months) Period : 2025-09-01 → 2026-08-31 | 1,707 | Criminal acts |
| Located criminal acts (previous 12 months) Period : 2024-09-01 → 2025-08-31 | 1,676 | Criminal acts |
| Dwellings on the assessment roll | 73,414 | Property assessment units |
| Median construction year | 1956 | Property assessment units |
| Dwellings built before 1960 | 63.0% | Property assessment units |
| Most frequent category Period : 2025-09-01 → 2026-08-31 | thefts from vehicles | Criminal acts |
| Share of the most frequent category Period : 2025-09-01 → 2026-08-31 | 28.1% | Criminal acts |
Regional context
| Indicator | Value | Source |
|---|---|---|
| Boroughs covered | 19 | Administrative boundaries of the agglomeration |
| Break-ins per 1,000 dwellings, all boroughs Period : 2025-09-01 → 2026-08-31 | 5.8 | Criminal acts |
| Criminal acts per 1,000 dwellings, all boroughs Period : 2025-09-01 → 2026-08-31 | 23.6 | Criminal acts |
| Average rent, Montréal CMA: one bedroom Period : 2025 | $1,131 | Average rents (Rental Market Survey) |
| Average rent, Montréal CMA: two bedrooms Period : 2025 | $1,346 | Average rents (Rental Market Survey) |
| Average rent, Montréal CMA: three bedrooms or more Period : 2025 | $1,625 | Average rents (Rental Market Survey) |
| Average rent, Montréal CMA: bachelor Period : 2025 | $1,005 | Average rents (Rental Market Survey) |
| Rent survey year | 2025 | Average rents (Rental Market Survey) |
| Share of criminal acts published without a location Period : 2025-09-01 → 2026-08-31 | 15.2% | Criminal acts |
Comments
No comments yet.